Peak Phase 5 — Measuring What We Actually Ship
Phase 5 started as an accuracy push and turned into a measurement audit. Phases 1–4 raised Peak SOR classification from 41.4% to 90.2% and reported a headline "soft accuracy" of 70.7%. Before trying to improve that number we asked what its denominator was. It was 82 rows — the ones that survived the matcher and a quality gate — out of 234 drawable SOR lines. Measured against every line the system is meant to answer, quantity accuracy within ±20% was 24.8%. Everything below follows from taking that seriously.
Every clause in that denominator was a filter the system controls. Tighten the matcher and the denominator shrinks — the ratio can rise while the number of correctly quantified SOR lines falls.
A metric you cannot game
Phase 5 reports three numbers that share one denominator — every drawable ground-truth line. Detection is "did it find the item on the drawing?". QA@20 is "is the number usable?" (within ±20%). QA@0 is exact equality. None of them can be improved by narrowing what counts as eligible.
We added a fourth, Cov@P90: the largest share of the bill the system can hand over at ≥90% precision, ranking lines by its own confidence. For a verification-first product that is the question that actually matters — not "how accurate is the AI" but "how much of this can a QS accept without checking". Abstention costs coverage but never precision, which is the right incentive.
We also closed an escape hatch. The old scorer excused metre items outside ±20% in either direction as "scope" noise. But partial page coverage can only ever make the system see less than a whole-building SOR line — an overcount is a double-count bug, not a scope artefact. Peak P&D overcounts run to ×17 (uPVC 150mm: SOR 23 m, AI 390 m). The largest failure mode in the project was, by construction, invisible to the published metric.
The ablation
Six cumulative configurations, scored offline against the cached Phase 2/3 extracts so every difference is attributable to the change under test rather than model sampling noise. The control reproduces the published Phase 4 numbers exactly, which is what licenses reading the deltas as causal.
| Config | Detection | QA@20 | Δ QA@20 | Intervention |
|---|---|---|---|---|
| phase4 | 54.3% | 24.8% (58/234) | — | control — reproduces published Phase 4 |
| M0 | 54.3% | 24.8% (58/234) | +0.0 pp | Phase 5 metrics only |
| A1 | 54.3% | 27.4% (64/234) | +2.6 pp | legend-only collapse |
| A2 | 54.3% | 32.9% (77/234) | +5.6 pp | within-drawing pipe max |
| A3 | 54.3% | 33.8% (79/234) | +0.9 pp | schedule-wins for counts |
| A4 | 55.1% | 33.8% (79/234) | +0.0 pp | drainage classifier split |
The M0 row is the most important line in this study. Switching to a stricter, wider-denominator metric changed the score by exactly zero. The gains that follow are real changes in output, not an artefact of redefining success.
| Sheet | Drawable | Detection | QA@20 (Phase 4 → 5) | Cov@P90 |
|---|---|---|---|---|
| P&D | 142 | 32.4% → 33.8% | 5.6% → 14.1% | 0.0% |
| FS | 59 | 81.4% (hold) | 49.2% → 64.4% | 33.9% → 66.1% |
| MVAC | 33 | 100% (hold) | 63.6% (hold) | 30.3% |
| Pooled | 234 | 54.3% → 55.1% | 24.8% → 33.8% | — |
FS is the clearest result: QA@20 up 15.2 points and Cov@P90 nearly doubling to 66.1%. Two thirds of the fire services bill can now be auto-accepted at ≥90% precision. MVAC is unchanged, and honestly so — its failures are undercounts of FCU schedule rows (9.0 kW: SOR 41, AI 12), which no aggregation rule can fix because the missing units were never extracted.
The FS ×2 was not what the summary said
Peak FS quantities were exactly double across six unrelated families — sprinklers 220→440, smoke detectors 38→76, breakglass 33→66, alarm bells 24→48. An exact 2.0 factor across unrelated families is structural duplication, not model miscounting. The obvious hypothesis — legend page plus plan page both counted — was wrong; the aggregator already drops legend copies when a plan member exists.
- The benchmark driver rewrites pageNumber = 1 for any element the model tags source: legend.
- FS pages 2 and 5 each reported the same plant-room schedule, so both collapsed to "page 1" and became indistinguishable.
- The legend filter only drops legend copies when a plan member exists. For schedule-only items none does — so both survived.
- The bucket summed two reads of one table.
We verified this directly in the artefacts: 22 groups in the FS raw extract are byte-identical (description, quantity) pairs whose ids say p2 and p5 while pageNumber says 1 for both. 56 of 161 FS items had a pageNumber contradicting their own id; P&D and MVAC had none. The fix is to carry provenance explicitly instead of overloading pageNumber, and collapse buckets whose members are all legend reads.
The largest single gain (+5.6pp) came from a related error one level up. Phase 4 de-duplicated pipes across drawings but left pages of one drawing summing. A riser diagram and the floor plans it feeds describe the same physical pipe. This is Peak P&D's residual 3–17× overcount — and it is exactly N23's uniform ×6 error, 6 being N23's page count.
A held-out project, and a 51-point parsing bug
Peak was the development set for Phases 1–4; N23 was seen in Phase 4. Neither supports a generalisation claim. So we added Kwai On Factory Estate — a Hong Kong Housing Authority public housing development, 678 priced P&D lines, 130 drawing PDFs — which no tuning pass had ever opened.
The first run classified 32.9% of its SOR lines, against 90.2% on Peak. That looked like a devastating generalisation failure. It was not — it was a ground-truth parsing bug. Kwai On nests headings three deep, and the material that determines the family sits two levels above the priced line: "Epoxy coated cast iron pipes and fittings to BS EN877" → "General pipeworks" → "100 mm diameter, 1369 m". Our converter kept only the nearest heading, so every priced line saw "General pipeworks" and the word "cast iron" was out of reach. It also wraps long descriptions across two rows, so "150 mm single branch junctions with bolted access" / "doors" was read as a heading plus an item called "doors".
| Ground-truth parsing | Classification |
|---|---|
| nearest heading only | 32.9% (223/678) |
| heading stack + wrapped-row rejoin | 84.5% (573/678) |
+51.6 points with no change to the classifier itself. Against Peak's 90.2%, the true held-out generalisation gap is about 6 points, not 57. On unseen projects the dominant error source was not vision and not classification — it was BOQ structure parsing.
Two silent fallbacks — including the images on this blog
Both defects had been shipping wrong output for two phases without raising a single error. They share one shape: a consumer reads a field that does not exist, gets undefined, and quietly takes a fallback branch.
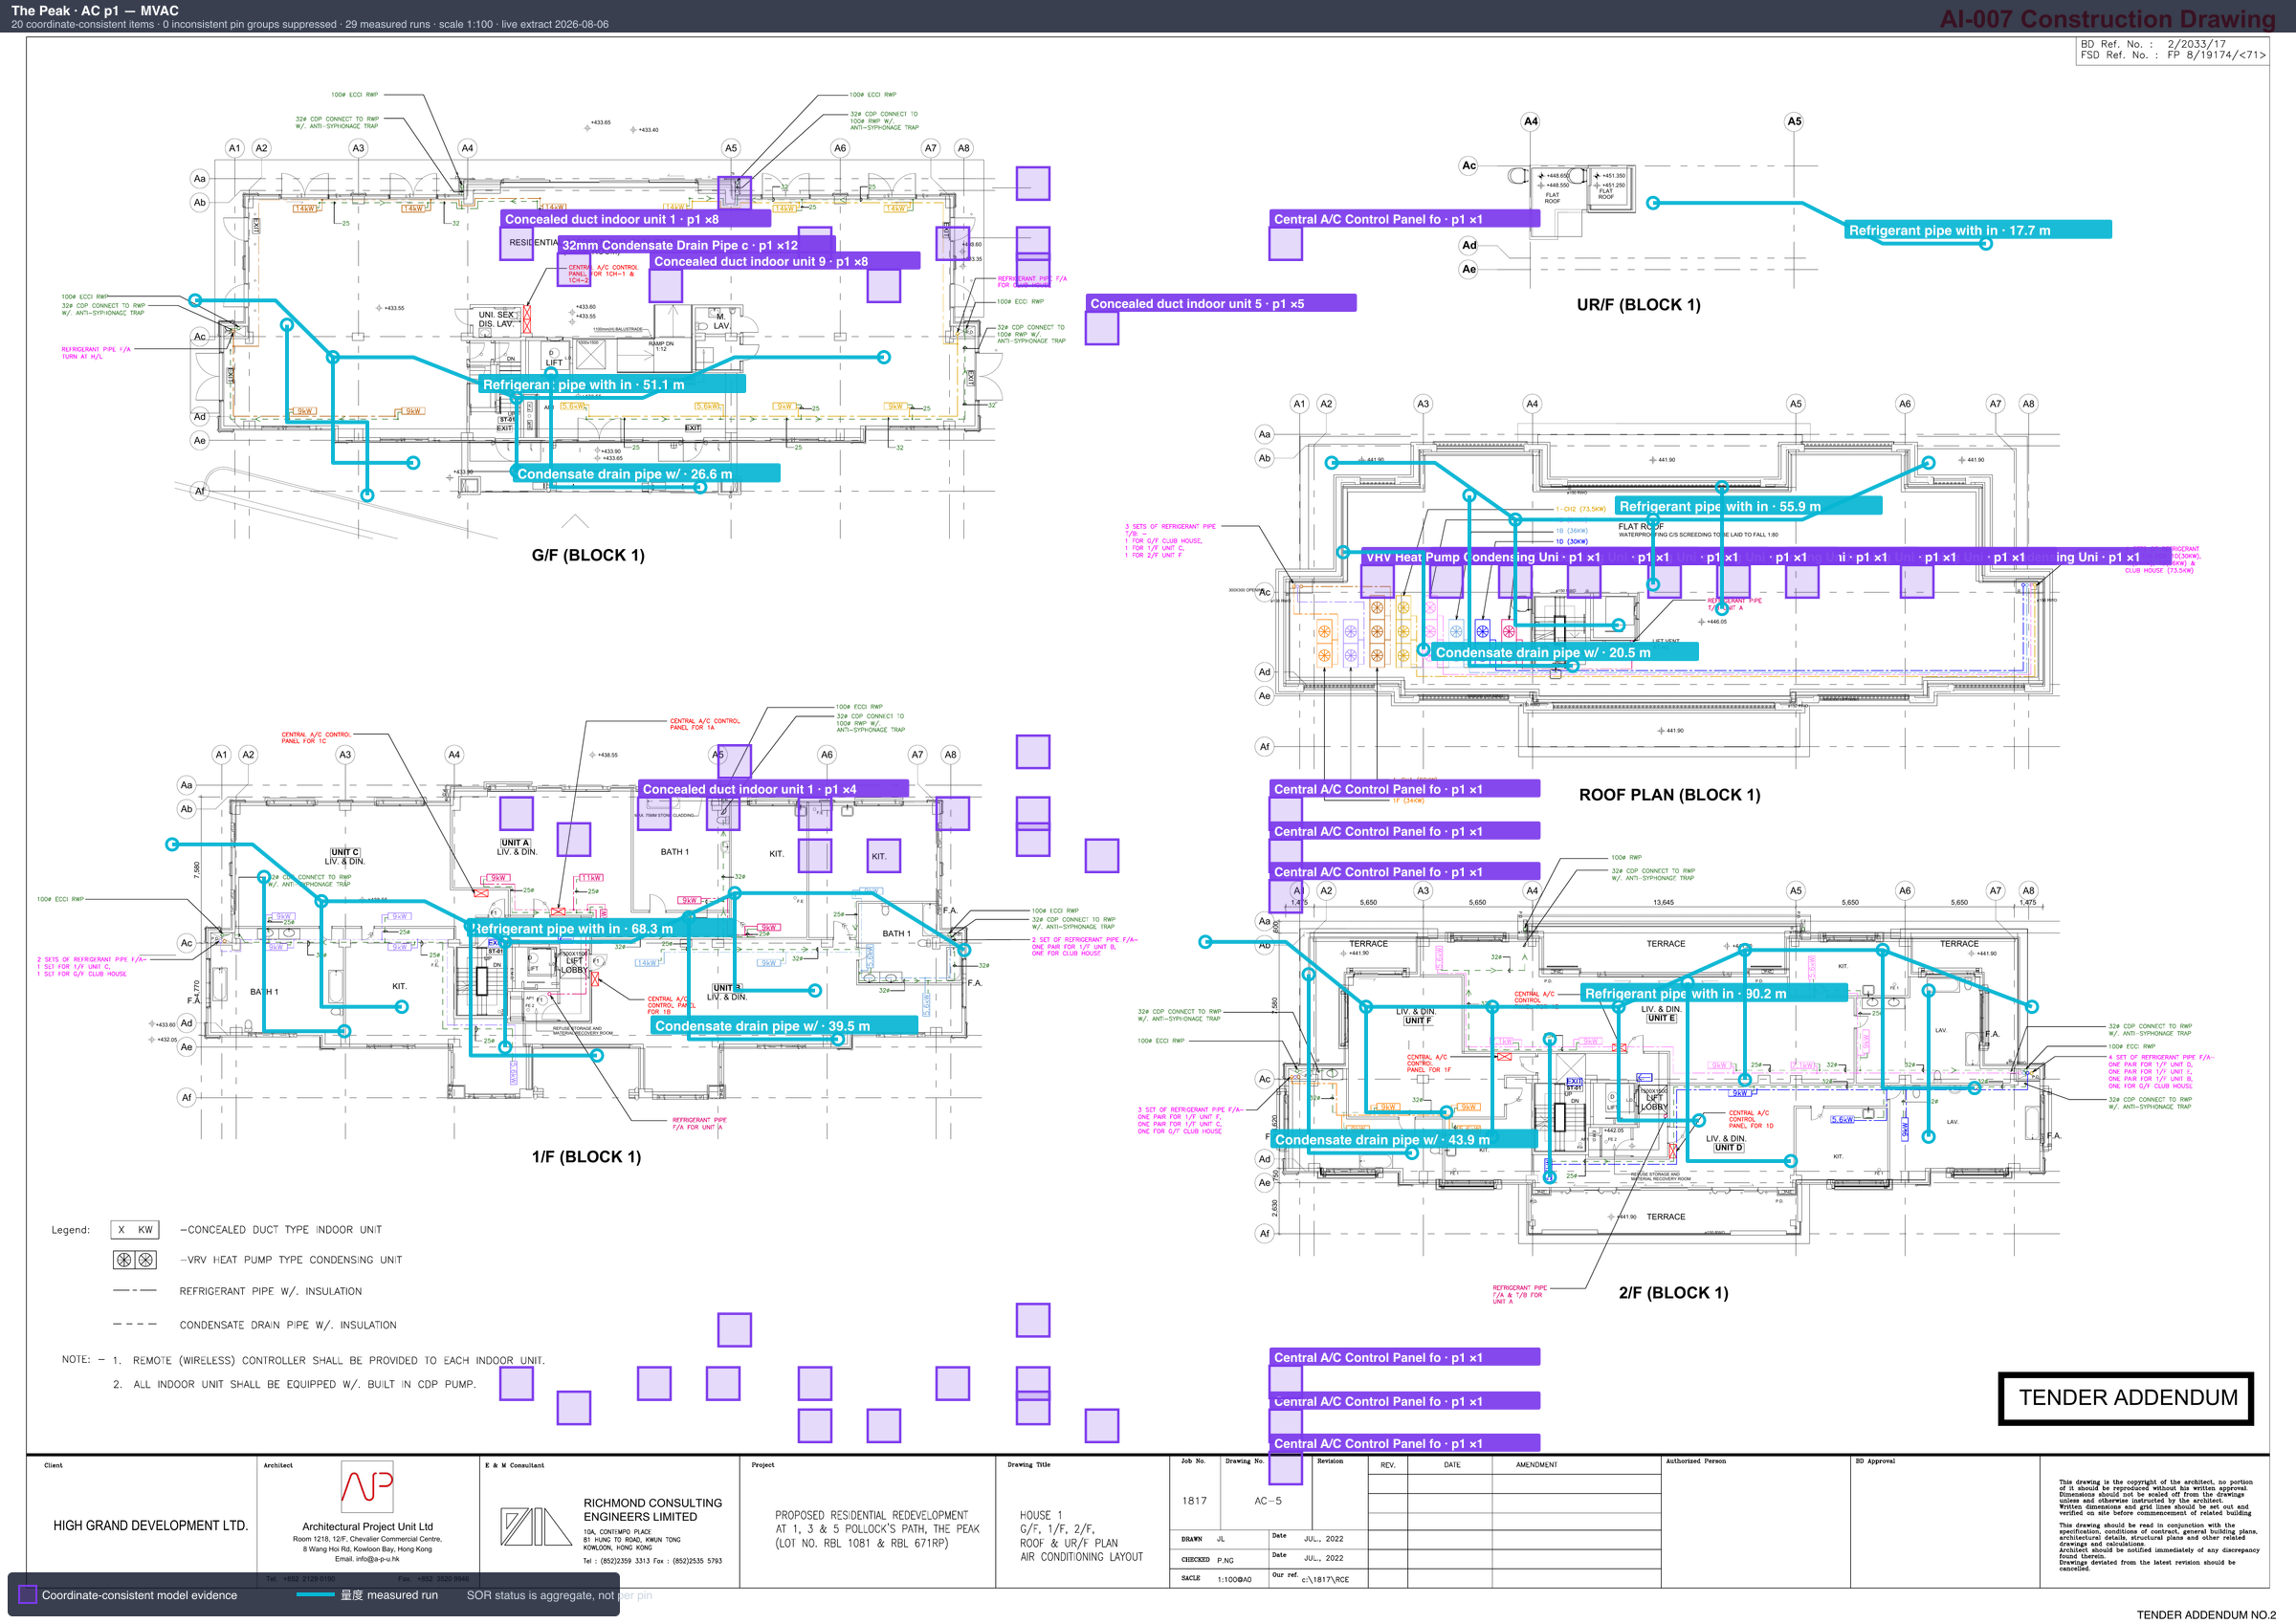
The first: our annotation script contained an offline demo branch that painted boxes on a hard-coded grid and drew "pipe runs" whose vertical position was a hash of the description string. It fired in live mode — all four vision calls returned empty, the empty result was cached as a 34-byte file, the "do we have real data?" check was false, and the demo branch ran. Those images were published to three posts on this blog under captions asserting they showed real matches. They did not. There were also no measurement labels, because the script called the prompt documented "NO polylines" and then read a field that prompt never returns; the real-geometry branch was dead from the day it was written.
The second we hit while rebuilding the renderer, which is the honest part of the story: the page-size helper returns { widthPt, heightPt } and the new code read { width, height }. Both undefined, every length NaN, NaN > 0 is false, and the label silently degraded to the model's own estimate. The images looked plausible and were wrong. That path now throws instead of degrading, and the vision prompts are now schema-constrained rather than enforced by prose.
| Length method | 50%-width run on a Peak A0 page |
|---|---|
| display size (rotation-aware, correct) | 59.4 m |
| MediaBox via pdf-lib getSize() | 42.1 m (−29%) |
Why detection did not move
Detection went 54.3% → 55.1%. Everything in this ablation is re-scoring and re-aggregation of already-extracted items; nothing can recover an item the extractor never emitted. P&D has 100 unmatched SOR lines, of which 32 are pipe fittings and 21 are valves — 53% of the misses are small diameter-sized components.
They are missing for a physical reason. A Peak A0 sheet renders at 7021×4967 pixels. Every extraction path then shrinks it to a single image capped at 2048–2560 pixels and re-encodes as JPEG quality 65. A 22 mm fitting symbol is about 8 pixels natively, 2–3 after downscaling, and gone after chroma subsampling. The prompt then compounds it by instructing the model to count fittings "only when clearly symbol-counted". Phase 5 ships and tests the tiling primitives that fix this — overlapping tiles at native resolution with seam de-duplication — but detection gains require a live re-extract, which is not in these numbers. We are not claiming them.
Stage conclusion: Phases 1 → 5 / 階段性總結
| Phase | What it established | Honest position afterwards |
|---|---|---|
| 1 | Classification 41.4% → 90.2% on 512 Peak SOR rows | We could name the item; we had not shown we could count it |
| 2 | First quantity audit; detection revealed at 23.8% | Detection, not classification, was the bottleneck |
| 3 | Detection-first: weighted detection 54.3% | P&D soft collapsed 72% → 17.4% — the metric was unstable |
| 4 | Recovery + N23 cross-project; pooled soft 70.7% | All of it re-scored from cached extracts, never measured live |
| 5 | QA@20 24.8% → 33.8%; Kwai On held-out 84.5% | The real number was always ~25%. Detection is the wall. |
The stated goal for this phase was above 90% on understanding a drawing and returning each quantity. We did not reach it and we are not going to report that we did. Fire services now meets the ≥90%-precision bar over two thirds of its bill, which is the first time any discipline has been genuinely production-usable on this dataset. P&D remains at 14.1% QA@20 and 0% coverage at 90% precision — there is no confidence threshold at which its numbers can be trusted unreviewed, and saying otherwise would be the same category of error as the fabricated images.
What Phase 5 did establish is a measurement floor that cannot drift, per-intervention attribution for every point claimed, a held-out project that says our generalisation gap is about 6 points rather than 57, and the removal of two silent fallbacks that had been quietly producing confident-looking wrong answers. Phase 6 is tiling, run live, against detection.
Related articles
Phase 28 — Coverage Ladder 5/21 Held; Count CP Still 3/63, Not 80/80
Phase 28 is the execute-close of the same qty_3d coverage + S33 count-CP families: inner COVERAGE_LADDER_PASS, five training_data graphs kept (S33, N23, Kwai On, S27, N22), fabricatedGeometry false. Extra S33 plan pages 12/14/16/19 raised world elements to 41 on the same slug — not a sixth coverage credit. Count CP stayed evaluated at 3/63 on S33 BQ sheet E (detection 5/63; N=63 held; reasonCode null). Frozen loop RSI_PLATEAU. Live 圖則.pdf is a residual, not a coverage credit. Not Peak P&D 3D 80/80. Not corpus 80–90%.
14 min readPhase 27 — Coverage Ladder 5/21; Count CP 3/63, Still Not 80/80
Phase 27 is the execute-close of the coverage-ladder 3→5 + S33 count-CP pack: COVERAGE_LADDER_PASS, five training_data graphs (S33, N23, and Kwai On preserved; S27 and N22 new), fabricatedGeometry false. Count CP is evaluated at 3/63 on S33 BQ sheet E — unblocked, not IDENTITY_ONLY_NO_GT, and not an accuracy win. S27 geometric takeoff was empty (NO_PLAN_POLYLINES); fittings-only still qualified. Live 圖則.pdf is a residual, not a coverage credit. Not Peak P&D 3D 80/80. Not corpus 80–90%.
12 min read