Phase 8 — Evidence-First Drawing Intelligence: From One-Shot Guesses to Traceable Quantities
A quantity is not trustworthy because a model can name it. It is trustworthy when the system can show where it was seen, how it was counted, how repeated views were reconciled, and when a human should doubt it.
We designate this work Phase 8: Evidence-First Drawing Intelligence. Phase 6 completed the live Peak tile accuracy sprint (pooled detection 78.2%, QA@20 38.0% — see /blog/peak-phase6-accuracy-sprint). Phase 7 independently repaired BOQ and ground-truth integrity. Phase 8 turns those lessons into an opt-in production evidence path that must pass its own frozen ablation before any additional headline uplift is claimed.
The bottleneck is evidence resolution, not one more score
Phase 5 made the denominator honest: Peak pooled QA@20 was 33.8% and detection 55.1% across 234 drawable ground-truth rows. P&D was the limiting sheet: 33.8% detection and 14.1% QA@20. Phase 6 live tiles moved P&D detection to 71.8% and pooled detection to 78.2%, while QA@20 only reached 38.0% pooled / 21.1% P&D — proving that finding symbols is not the same as usable quantities. The recurring missing mass for small fittings remains partly physical: A0 sheets at ~7021×4967 px still lose detail under aggressive cost ceilings. No ranking rule can recover an object that was removed by the input transform.
| Project / evidence state | Drawable rows | Detection | QA@20 | Interpretation |
|---|---|---|---|---|
| Peak, Phase 6 merge (P&D live tiles) | 234 | 78.2% | 38.0% | P&D det 71.8% / QA@20 21.1%; FS/MVAC offline hold |
| Peak, Phase 5 A4 re-score (baseline) | 234 | 55.1% | 33.8% | Pre-tile one-shot baseline |
| N23, frozen 7-page extract + A4 aggregation | 9 | 88.9% | 77.8% | Offline re-aggregation, not a new live vision result |
| Central Police Station, first live baseline | 13 | 61.5% | 38.5% | INFO baseline; PDF BQ headings remain a confound |
These are deliberately heterogeneous studies. Peak tests a dense multi-discipline tender, N23 tests Chinese P&D and cross-page aggregation, and CPS tests an unseen PDF bill. They do not average into a product claim. Together they prevent a Peak-only optimisation from masquerading as general drawing understanding.
A platform architecture for traceable quantity
| Layer | Question it answers | Phase 8 implementation |
|---|---|---|
| Overview semantics | What sheet, floor, discipline and legend am I looking at? | Existing overview extraction remains the low-cost inventory and routing pass. |
| Native evidence | Is the small object actually present and where? | Overlapping high-resolution tiles preserve native symbols; each tile-local point is mapped back to display coordinates. |
| Reconciliation | Did two tiles or plan/legend views see the same thing? | Seam-aware de-duplication merges only compatible, spatially close evidence. |
| Targeted count | Which count needs a second look? | A schema-constrained recount runs only for capped, review-worthy count types; linear quantities stay with geometry. |
| Decision and review | May this claim be used without review? | Evidence links, confidence and review priority remain first-class output; an unlocated tally never creates a new claim. |
The implementation is opt-in behind EVIDENCE_TILED_EXTRACT=1 and EVIDENCE_TARGETED_RECOUNT=1. It preserves TeraQuant’s rotation-aware display coordinate system, uses the tested tile planner and local-to-global transform, rejects tile-only unlocated claims, and records evidence-pass cost and latency beside the existing model run. That is a controlled experiment surface, not a silent production switch.
Annotation integrity is part of accuracy
We also corrected the visual evidence standard. Earlier Phase 3 imagery was withdrawn because an offline demo fallback could draw plausible but fabricated positions, and it had no real measurement geometry. The renderer now has no demo path; it refuses empty source data, reads actual length polylines, computes metres in the rotation-aware display space, suppresses count/location-inconsistent pins, and keeps project-level SOR comparison separate from each page-local position.
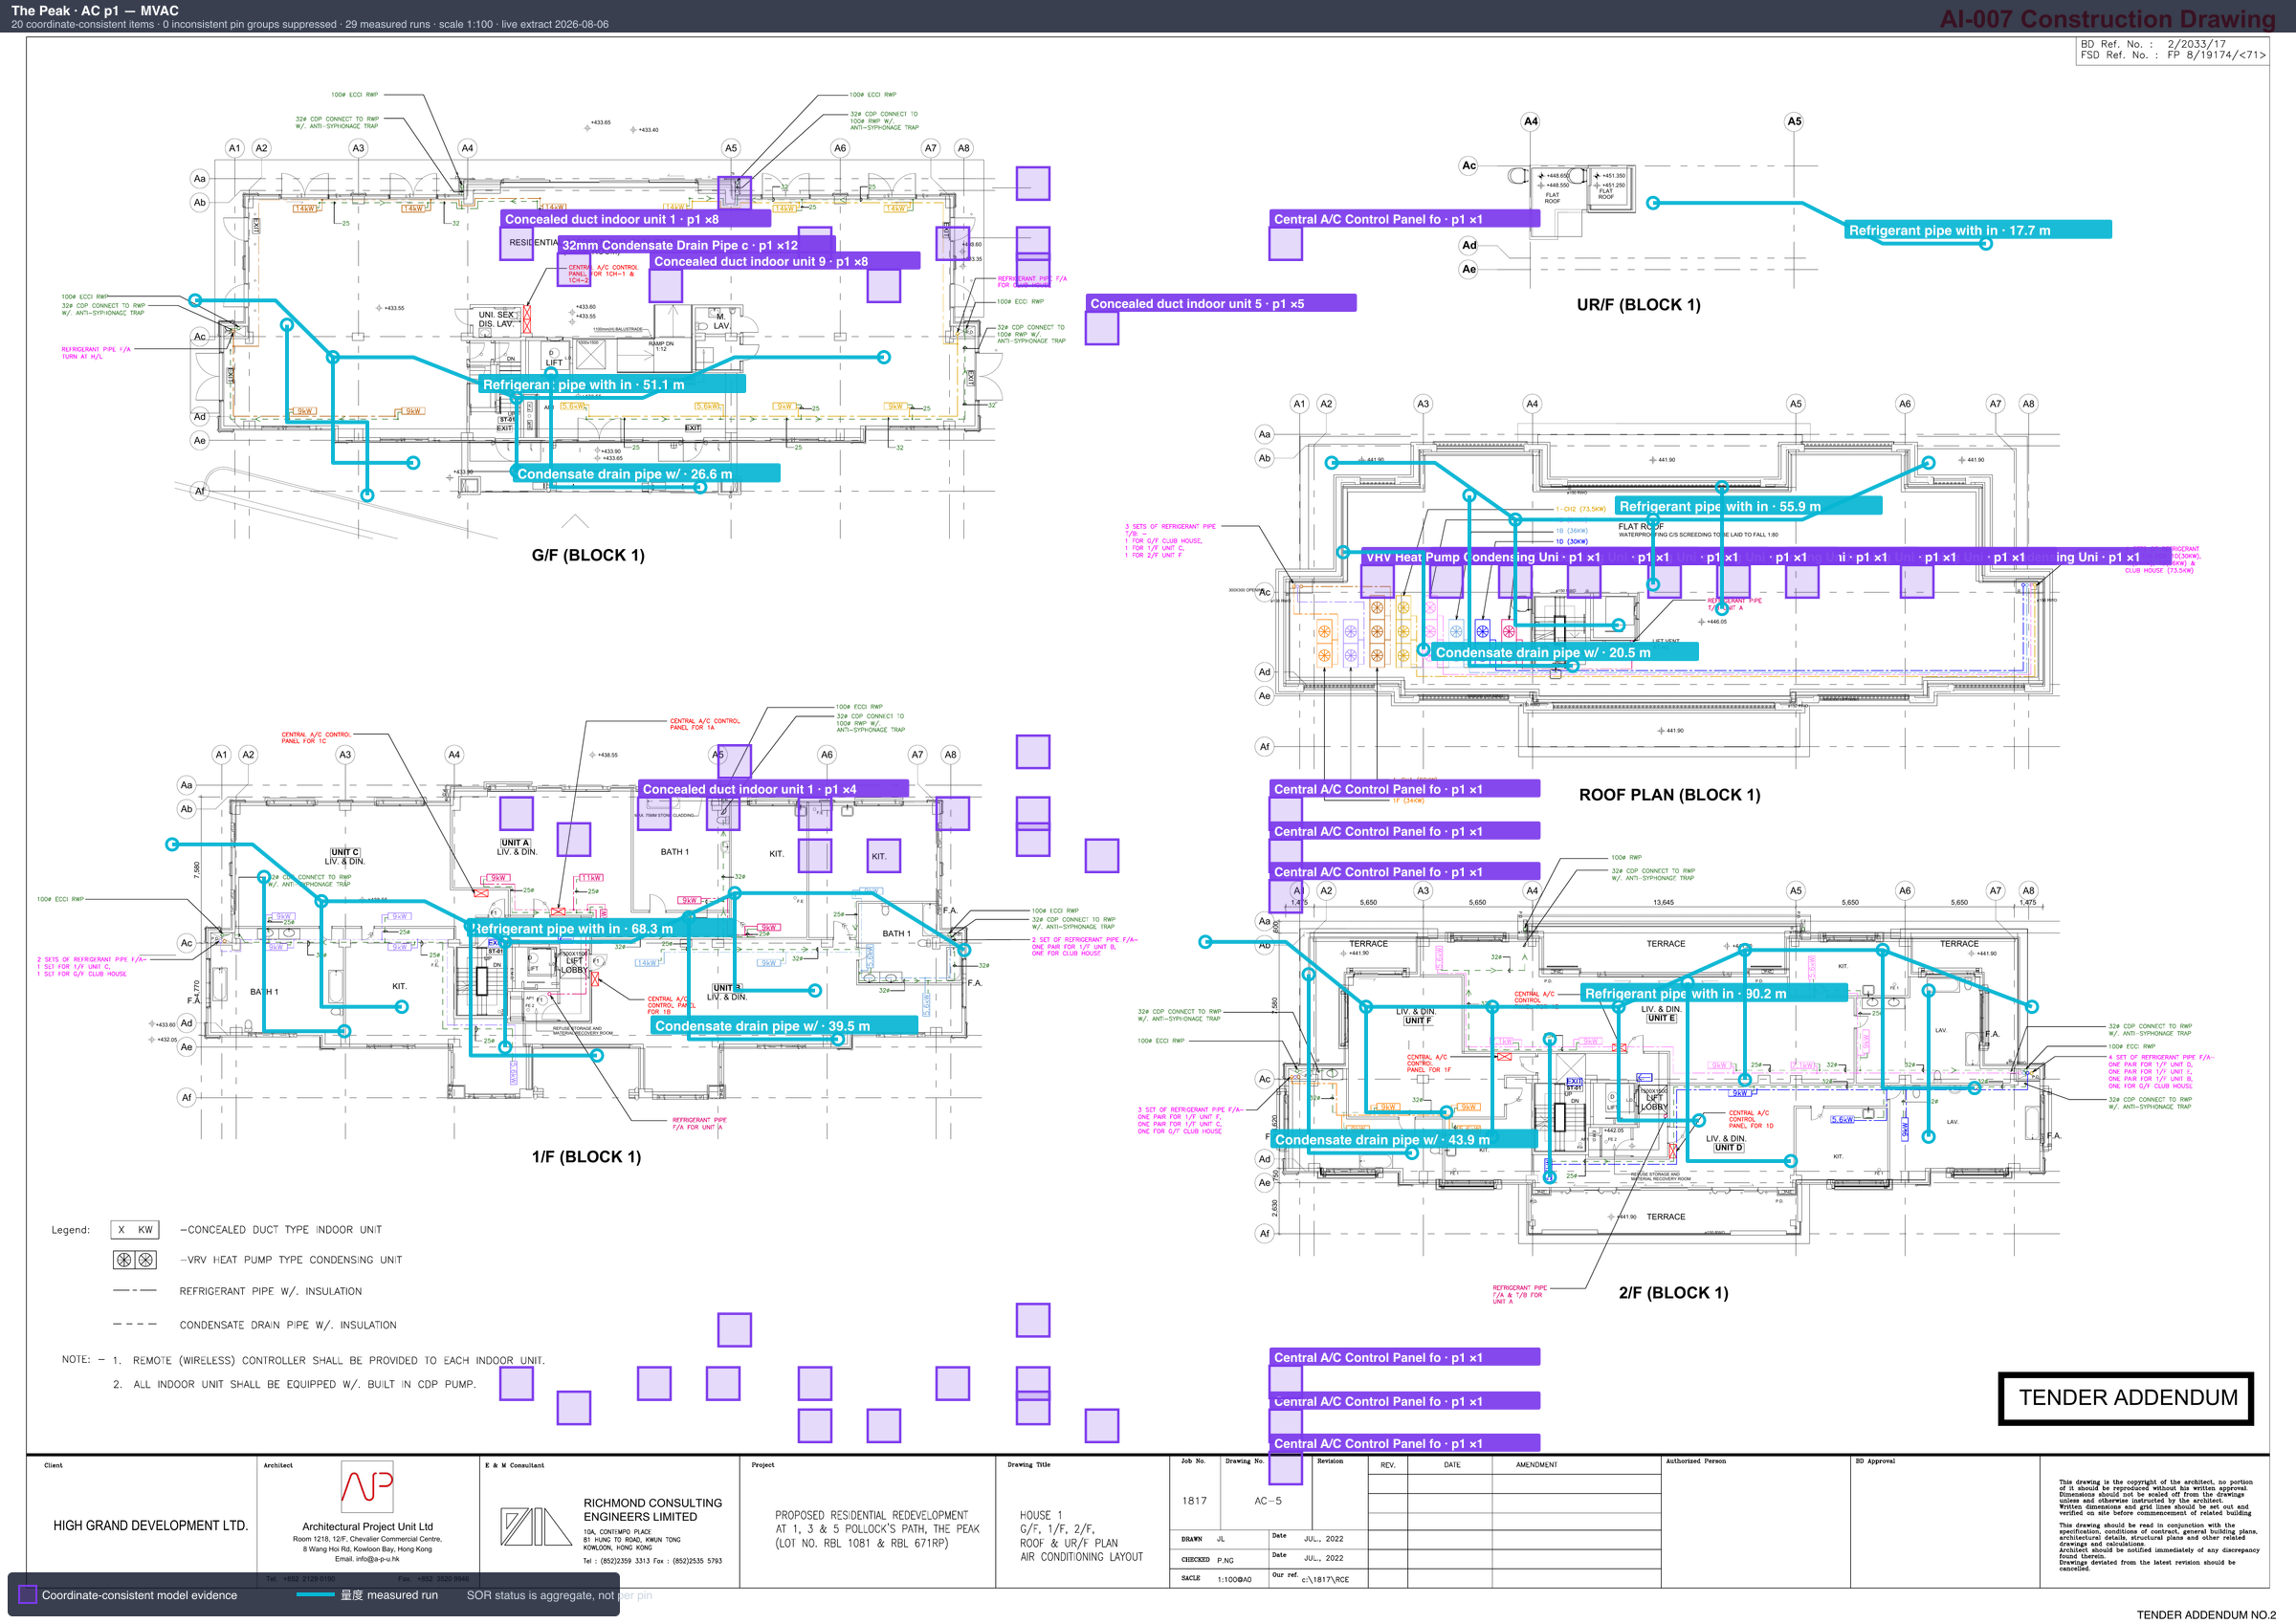
Evaluation protocol and the next claim we are allowed to make
- Freeze the existing extraction and score it beside the Phase 8 evidence path on the same drawable rows. Report detection, QA@20, QA@0, selective coverage, latency, image count and estimated cost together.
- Run the primary ablation on Peak P&D, where fittings and valves dominate the remaining miss mass; keep FS and MVAC as regression sheets rather than tuning targets.
- Repeat only the frozen protocol on N23 and CPS. Label N23 as offline re-aggregation until a fresh live extract exists, and keep CPS INFO until its PDF-BQ parser is independently audited.
- Promote the flags only after a pre-registered comparison improves measured quantity quality without concealing a cost, coverage or cross-project regression.
Phase 6 published measured live-tile gains on Peak P&D; Phase 8 still reports no separate product-default uplift until its opt-in path is ablated on frozen rows. The present achievement is a deployed, reversible evidence path; three-project baselines; an annotation standard that cannot fabricate geometry; and a protocol under which the next improvement can be believed or rejected. The goal remains significant per-line quantity accuracy, but the platform will earn that claim one visible item at a time.
Related articles
Phase 28 — Coverage Ladder 5/21 Held; Count CP Still 3/63, Not 80/80
Phase 28 is the execute-close of the same qty_3d coverage + S33 count-CP families: inner COVERAGE_LADDER_PASS, five training_data graphs kept (S33, N23, Kwai On, S27, N22), fabricatedGeometry false. Extra S33 plan pages 12/14/16/19 raised world elements to 41 on the same slug — not a sixth coverage credit. Count CP stayed evaluated at 3/63 on S33 BQ sheet E (detection 5/63; N=63 held; reasonCode null). Frozen loop RSI_PLATEAU. Live 圖則.pdf is a residual, not a coverage credit. Not Peak P&D 3D 80/80. Not corpus 80–90%.
14 min readPhase 27 — Coverage Ladder 5/21; Count CP 3/63, Still Not 80/80
Phase 27 is the execute-close of the coverage-ladder 3→5 + S33 count-CP pack: COVERAGE_LADDER_PASS, five training_data graphs (S33, N23, and Kwai On preserved; S27 and N22 new), fabricatedGeometry false. Count CP is evaluated at 3/63 on S33 BQ sheet E — unblocked, not IDENTITY_ONLY_NO_GT, and not an accuracy win. S27 geometric takeoff was empty (NO_PLAN_POLYLINES); fittings-only still qualified. Live 圖則.pdf is a residual, not a coverage credit. Not Peak P&D 3D 80/80. Not corpus 80–90%.
12 min read